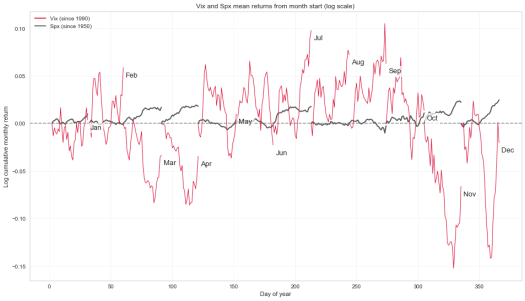
While seeing some “sell in may” headlines a while ago, thought i’d pull up the monthly mean returns for spx and vix. I wanted to see them on an even keel, so that each month starts at 0%, to better gauge their monthly behaviour
import pandas as pd
import numpy as np
import matplotlib.pyplot as plt
import seaborn as sns
import quandl
import calendar

%matplotlib inline
sns.set(style="whitegrid")
Since yahoo data went dark, had to pull it in manually. There is a more intelligent solution posted in Trading With Python blog
spx = pd.read_csv("../Data/Spx.csv", index_col="Date")
spx.index = pd.to_datetime(spx.index, format="%Y-%m-%d")
spx = spx.apply(pd.to_numeric, errors="coerce")

vix = pd.read_csv("../Data/Vix.csv", index_col="Date")
vix.index = pd.to_datetime(vix.index, format="%Y-%m-%d")
vix = vix.apply(pd.to_numeric, errors="coerce")
Adding dates and stuff to dataframes
def DatesAndPct(df):
 df["day"] = df.index.dayofyear
 df["month"] = df.index.month
 df["year"] = df.index.year
 df["pct"] = np.log(df["Adj Close"]).diff()
 return df

spx = DatesAndPct(spx)
vix = DatesAndPct(vix)
Making a function for plots and plotting e‘m all at once
plt.figure(figsize=(16, 9))
label_props = dict(boxstyle="square", facecolor="w", edgecolor="none", alpha=0.69)

def plotMonths(df, color, line=1, m_names=True):
 df.index = pd.to_datetime(df.index, format="%Y-%m-%d")
 df.set_index(df["day"], inplace=True, drop=True)

 for i in range(1, 13):
 month_name = calendar.month_abbr[i] # Adding month name

 data = df[df["month"] == i]
 out = data["pct"].groupby(data.index).mean()
 out.iloc[0] = 0 # Setting returns to start from zero

 # Getting coordinates for month name labels
 x = out.index[-1]+2
 y = out.cumsum().iloc[-1]-0.01

 # Plotting
 plt.plot(out.cumsum(), linewidth=line, color=color, label="_nolabel_")
 if m_names == True:
 plt.text(x, y, month_name, size=13, bbox=label_props)

plotMonths(spx, "#555555", 2, m_names=False)
plotMonths(vix, "crimson", m_names=True)

plt.title("Vix and Spx mean returns from month start (log scale)")
plt.plot([], [], label="Vix (since 1990)", color="crimson") # Adding custom legends
plt.plot([], [], label="Spx (since 1950)", color="#555555") # Adding custom legends
plt.axhline(linestyle="--", color="#555555", alpha=0.55)
plt.grid(alpha=0.21)
plt.legend(loc="upper left")
plt.xlabel("Day of year")
plt.ylabel("Log cumulative monthly return")
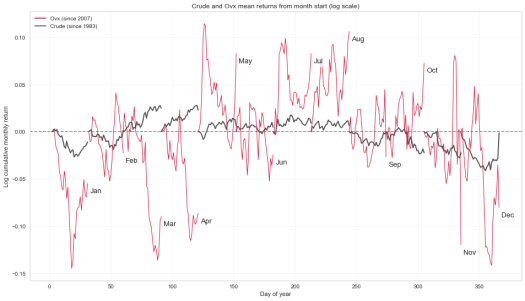
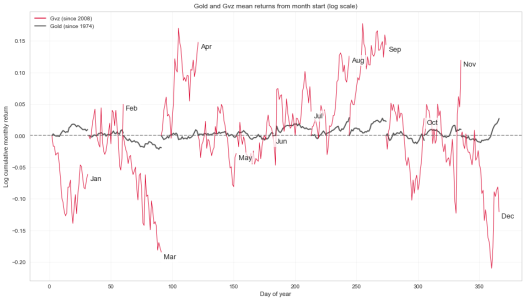
While im at it, since Crude and Gold also have volatility indexes available, also pulled summaries for them. Crude vs Ovx and Gold vs Gvz
Thanks for your time


Quantocracy's Daily Wrap for 05/25/2017 | Quantocracy