Well, Its here, spot Vix close below 10. From what i read from the web, people are piling into short vol strategies on an escalating scale. I suspect unwinding of that trade will be rather brutal. I wish good luck to every short vol trader out there and dont forget to wear a helmet :)
import pandas as pd
import numpy as np
import matplotlib.pyplot as plt
import seaborn as sns
import quandl

sns.set(style="whitegrid")
%matplotlib inline

vix = quandl.get("YAHOO/INDEX_VIX", authtoken="YOUR_KEY")
vix.index = pd.to_datetime(vix.index)
vix.drop({"Open", "High", "Low", "Close", "Volume"}, inplace=True, axis=1)
vix.columns = ["close"]
vix["pct"] = np.log(vix["close"]).diff()
Lets look at all instances where Vix closed below 10 (if prev close was >= 10)
heat = vix[(vix["close"].shift(1) > 10) & (vix["close"] < 10)].transpose().iloc[:1]
heat.columns = heat.columns.map(lambda x: x.strftime("%Y-%m-%d"))

cmap = sns.dark_palette("red", as_cmap=True)

fig, ax = plt.subplots(1, figsize=(16, 9))
ax = sns.heatmap(heat, square=True, cmap=cmap, linewidths=1,
 annot=True, cbar=False, annot_kws={"size":42}, fmt="g")
ax.axes.get_yaxis().set_visible(False)
plt.title("All Vix closes < 10 since 1993 (if previous close was >= 10)")
Closes below 10 are rare
ecd = np.arange(1, len(vix)+1) / len(vix)

plt.figure(figsize=(11, 11))
plt.plot(np.sort(vix["close"]), ecd, linestyle="none", marker=".", alpha=0.55, color="#555555")
plt.axvline(10, linestyle="--", color="crimson", label="Vix below 10 threshold")
plt.grid(alpha=0.21)
plt.title("Vix daily close values Ecdf")
plt.xlabel("Vix close")
plt.ylabel("Percentage of closes that are less than corresponding closes on x")
plt.legend(loc="center right")
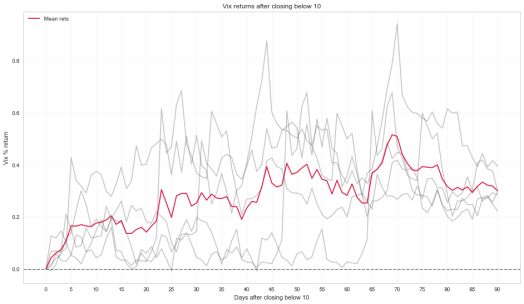
According to the few past instances, Vix should live’n up in the coming days
def getRets(df, days):
df = df.reset_index()
df_out = pd.DataFrame()
for index, row in df.iterrows():
if df["close"].iloc[index-1] >= 10 and df["close"].iloc[index] < 10:
ret = df["pct"].iloc[index:index+days]
#ret = np.log(ret).diff()
ret.iloc[:1] = 0
ret.reset_index(drop=True, inplace=True)
df_out[index] = ret

return df_out

vix_21rets = getRets(vix, 90+1)

plt.figure(figsize=(16, 9))
plt.plot(vix_21rets.cumsum(), color="#555555", alpha=0.34, label="_nolegend_")
plt.plot(vix_21rets.mean(axis=1).cumsum(), color="crimson", label="Mean rets")
plt.grid(alpha=0.21)
plt.title("Vix returns after closing below 10")
plt.ylabel("Vix % return")
plt.xlabel("Days after closing below 10")
plt.axhline(linestyle="--", linewidth=1, color="#333333")
plt.xticks(np.arange(0, 90+1, 5))
plt.legend(loc="upper left")
Notebook:
https://github.com/Darellblg/voodoomarkets/blob/master/BlogVixBelowLow.ipynb
Thanks your time and feel free to leave a comment


Quantocracy's Daily Wrap for 05/09/2017 | Quantocracy
The expected mean rate (red line) in your graph above mirrors almost exactly the current term structure (see vixcentral.com). Buying volatility now via futures or ETFs ( the VIX index itself is not investable and all volatility products are priced off the VIX futures ) gives someone no inherent apriori advantage. Nice example of (almost) efficient markets working.
This obviously does not mean that a “Buy” at the current levels can not be profitable, it only shows that you have no edge by going long volatility solely based on the fact that the VIX is below 10.
Couldn’t agree more with you on this.
“From what I read from the web, people are piling into short vol strategies on an escalating scale. I suspect unwinding of that trade will be rather brutal. I wish good luck to every short vol trader out there and don’t forget to wear a helmet :)”.
This is my feeling also. But if the short vol trade signal is daily, the trader will do ok. The unwinding will be brutal. As your post stated.
Thanks for your works & post your codes.
Just to add some thoughts:
“The unwinding will be brutal.” Yes, when the time is right to unwinding the short vol trade. The time is not today or next week. It may take several more weeks or months. It is more linked to global or US macro trade, especially linked to S&P 500. The unwinding sentiment is not there yet. This is my opinion.
Hi Helmuth and thanks for pitching in
I agree, one (rational?) way of looking at it is that going long volatility only makes sense when vol is high or in backwardation, its the only time long vix etn’s have some backwind. However buying cheap and selling dear is tempting as always. With the mean (red line) i was just trying to see how vix has “behaved” after closing below 10. Buying long vol etn’s does not make sense here since vix can stay below 10 but the futures they keep on converging to spot and hit vxx where it hurts
yeah, by unwinding i meant a longer term process, not a single event. If anything a single volatility event will entice even more people to the short vol trade. If the short vol trade is to unwind, a prolonged correction is in order. By butal, im thinking xiv pullback in excess of 50%
Normally the SPY and XIV has approximately 1 to 5 relationship. For XIV to cut in half (down 50%), you imply to SPY to down 10% or more in the coming future – “a prolonged correction” indeed. Thanks for your post codes.
You are right about everyone becoming a vol seller these days. Artemis Capital has been referring to them as volatility “tourists”. Consultants have successfully convinced pension funds (big money investors) to do do cash secured index put selling using their short-duration t-bonds as the cash component which contributes to compressed VIX. I particularly appreciate your Python code here it’s very helpful and I look forward to more of your posts. Frank
We just experienced an explosive and fast VIX move today.
I believe today is one of largest Close to Close spikes in Vix in term of 46.3%.
Hi and thanks for the reply. I had not seen Artemis Cap before, they have good research there. I especially like the Prisoners Dilemma slides http://www.cboe.com/rmc/2015/asia/Chris-Cole-slides-RMC-Asia-2015-Artemis-CBOERMC-December12015.pdf
Regarding code, i am just a beginner so my code is probably suboptimal. However i can recommend datacamp.com as a good site where to learn
yeah, i think the biggest one was on feb 27, 2007, vix spiked 64% from previous close