Since today is Fed day, i thought id take a look at how rate decisions have affected Vix. Vix data starts from early 90’s so we’ll have start from there.
import quandl
import pandas as pd
import numpy as np
import matplotlib.pyplot as plt
import seaborn as sns
import datetime as dt
from pandas.tseries.offsets import *

sns.set(style="whitegrid")
%matplotlib inline

fed = pd.read_csv("fed_dates.csv", index_col="Date")
fed.index = pd.to_datetime(fed.index, format="%m/%d/%Y")
fed["Rate"] = fed["Rate"].apply(lambda x: x[:-1])

vix = quandl.get("YAHOO/INDEX_VIX", authtoken="YOUR_TOKEN_HERE")
vix["pct"] = np.log(vix["Close"]).diff()
Setting up the rate decision dates
fed_raised = fed[fed["Rate"] > fed["Rate"].shift(1)]
fed_lowered = fed[fed["Rate"] < fed["Rate"].shift(1)]
fed_unch = fed[fed["Rate"] == fed["Rate"].shift(1)]
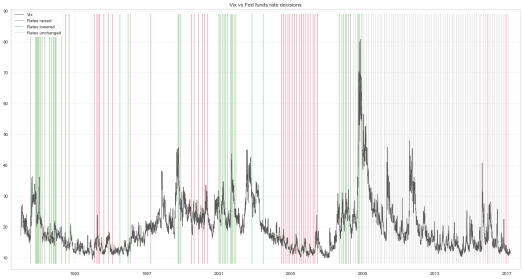
Eyeballing all rate decisions since early 90’s along with Vix.
Clicking on the plot, summons you a bigger version.
sdate = vix.index[1] # When vix data starts

fig = plt.figure(figsize=(21, 11))

plt.plot(vix["Close"], linewidth=1, color="#555555", label="Vix (Log scale)")
plt.vlines(fed_raised.loc[sdate:].index, 8, 89, color="crimson", alpha=0.34, label="Rates raised")
plt.vlines(fed_lowered.loc[sdate:].index, 8, 89, color="forestgreen", alpha=0.34, label="Rates lowered")
plt.vlines(fed_unch.loc[sdate:].index, 8, 89, color="k", alpha=0.11, label="Rates unchanged")

plt.grid(alpha=0.21)
plt.title("Vix vs Fed funds rate decisions")
plt.margins(0.02)
plt.legend(loc="upper left", facecolor="w", framealpha=1, frameon=True)
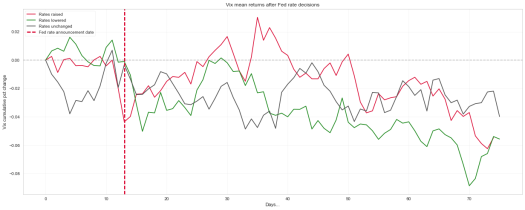
The sample size is small, nevertheless lets look at how Vix has behaved in rate increases, decreases and when rates have unchanged
def get_rets(dates):
days_before = 10+1
days_after = 64+1
out_instances = pd.DataFrame()

for index, row in dates.iterrows():
start_date = index - BDay(days_before)
end_date = index + BDay(days_after)

out = vix["pct"].loc[start_date: end_date]
out.reset_index(inplace=True, drop=True)
out = out.fillna(0)
out_instances[index] = out

out_instances.ix[-1] = 0 # Starting from 0 pct
out_instances.sort_index(inplace=True)
out_instances.reset_index(inplace=True)
out_instances.drop("index", axis=1, inplace=True)
return out_instances

inst_raised = get_rets(fed_raised.loc[sdate:])
inst_lowered = get_rets(fed_lowered.loc[sdate:])
inst_unch = get_rets(fed_unch.loc[sdate:])

fig = plt.figure(figsize=(21, 8))

plt.plot(inst_raised.mean(axis=1).cumsum(), color="crimson", label="Rates raised")
plt.plot(inst_lowered.mean(axis=1).cumsum(), color="forestgreen", label="Rates lowered")
plt.plot(inst_unch.mean(axis=1).cumsum(), color="#555555", label="Rates unchanged")
plt.axvline(13, color="crimson", linestyle="--", alpha=1, label="Fed rate announcement date")
plt.axhline(0, color="#555555", linestyle="--", alpha=0.34, label="_no_label_")
plt.title("Vix mean returns after Fed rate decisions")
plt.ylabel("Vix cumulative pct change")
plt.xlabel("Days...")
plt.grid(alpha=0.21)
plt.legend(loc="upper left", facecolor="w", framealpha=1, frameon=True)
Thanks your time and feel free to leave a comment


